zabbix配置percona的插件获取更详细的mysql监控信息
一、前言
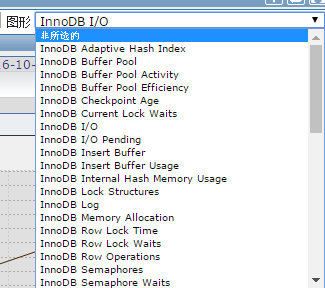
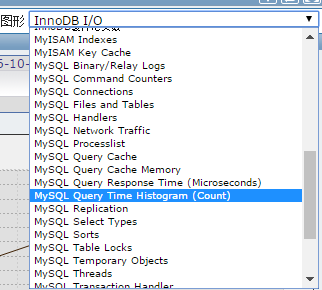
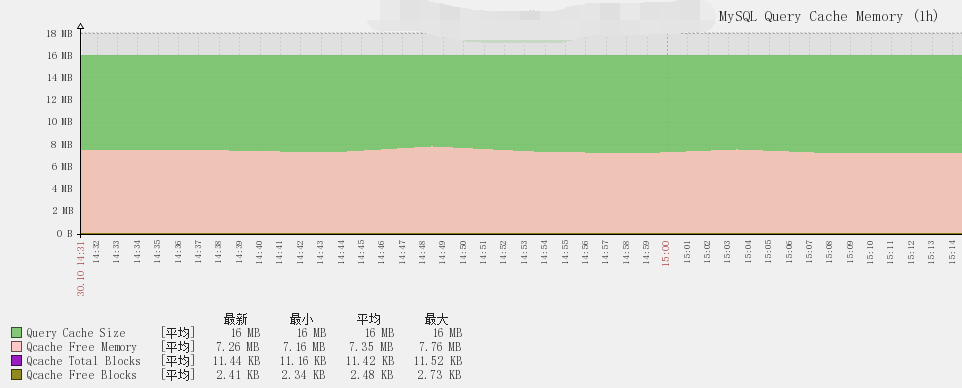
前段时间用了下zabbix+percona的插件监控MySql,感觉不错,内置了190多个监控项,40多个图形展示。对MySql的监控比较全面,自己导入模版之后稍微根据自己的需求进行修改就可以使用。
https://www.percona.com/doc/percona-monitoring-plugins/1.1/zabbix/index.html
二、部署
部署前提:你已经在MySql数据库添加安装好了zabbix-agent环境,并且在zabbix-server端添加agent
1、安装percona仓库
rpm -ivh http://www.percona.com/downloads/percona-release/redhat/0.1-3/percona-release-0.1-3.noarch.rpm
2、部署监控环境
Percona的监控插件是php编写的。通过php连接MySql来获取相关数据,所以需要你在本地安装php环境和php-MySql环境
yum -y install php php-mysql
3、安装percona的zabbix模版
yum -y install percona-zabbix-templates
安装完成生成如下文件
# rpm -ql percona-zabbix-templates
/var/lib/zabbix/percona
/var/lib/zabbix/percona/scripts
/var/lib/zabbix/percona/scripts/get_mysql_stats_wrapper.sh
/var/lib/zabbix/percona/scripts/ss_get_mysql_stats.php
/var/lib/zabbix/percona/templates
/var/lib/zabbix/percona/templates/userparameter_percona_mysql.conf
/var/lib/zabbix/percona/templates/zabbix_agent_template_percona_mysql_server_ht_2.0.9-sver1.1.6.xml
可以看到他的组成部分有一个shell脚本,一个php脚本,一个zabbix的配置文件,和一个Zabbix 模版的xml。下面我们需要引用配置文件,并在Zabbix上来导入该模版。
4、复制用户自定义配置项到zabbix配置目录
cp /var/lib/zabbix/percona/templates/userparameter_percona_mysql.conf /etc/zabbix/zabbix_agentd.d/
5、让php可以连接到MySql上
授权监控用户
MariaDB [(none)]> grant select,process,replication client on *.* to zabbix@'192.168.10.31' identified by 'zabbixpass';
MariaDB [(none)]> flush privileges;
修改php文件
vim /var/lib/zabbix/percona/scripts/ss_get_mysql_stats.php
$mysql_user = 'zabbix';
$mysql_pass = 'zabbixpass';
修改监控脚本HOST选项,为MySql服务器IP地址
# vim /var/lib/zabbix/percona/scripts/get_mysql_stats_wrapper.sh
HOST=192.168.10.31
6、测试监控脚本是否可用
# /var/lib/zabbix/percona/scripts/get_mysql_stats_wrapper.sh gg
405647
7、导入zabbix模版
将/var/lib/zabbix/percona/templates/zabbix_agent_template_percona_mysql_server_ht_2.0.9-sver1.1.6.xml下载到本地,然后在zabbix上导入
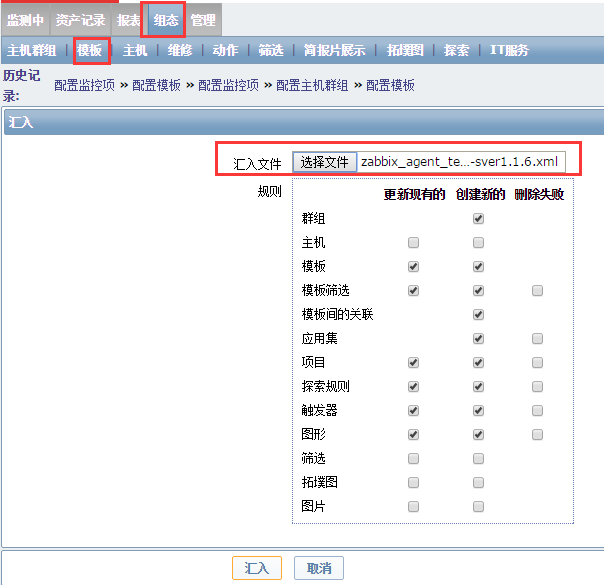
下面你就可以给你的MySQL数据库指定监控模板了,由于篇幅原因就不在截图。
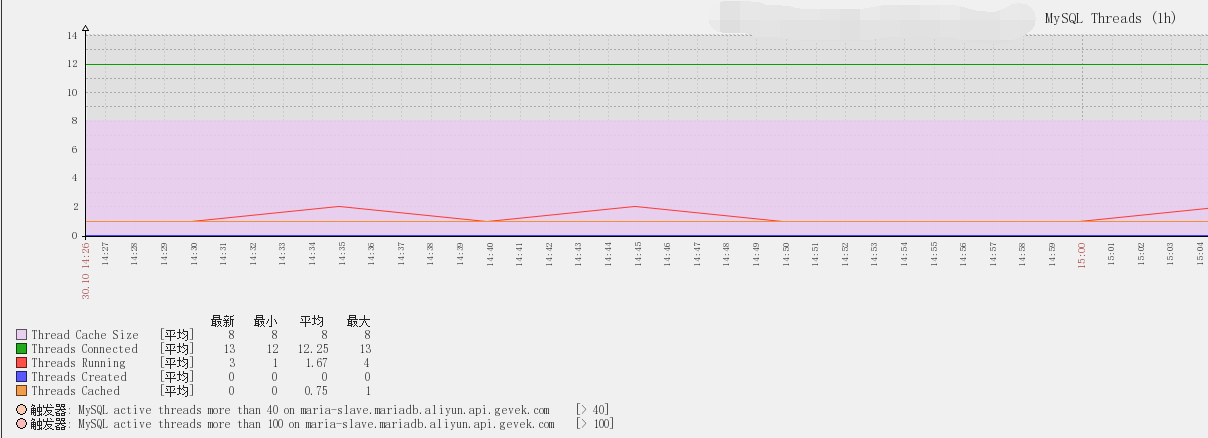
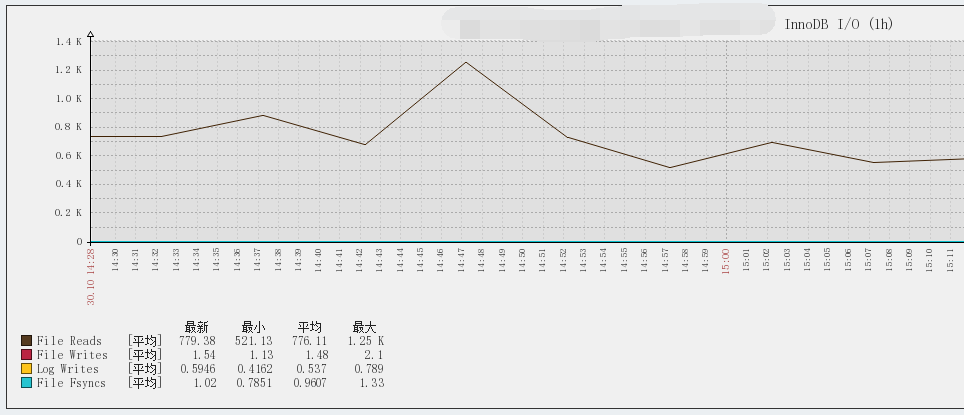
三、监控结果展示
标签云
-
PythonDebianSnmpWgetMacOSRedhatVPSKubernetesDeepinGoogleLVMMariaDBNginxOffice容器缓存ZabbixUbuntuAnsibleCactiMemcacheSVNFlask代理服务器部署SwarmLighttpdSaltStackSystemdOpenVZGITDockerLUAMongodbAndroid备份KotlinPuttyOpenStackiPhoneRedisVagrantWiresharkKloxoSambaTomcatVirtualboxBashOpenrestyYumLinuxSocketKVMRsyncCentosWordPressCrontabFirewalldVsftpdShellIptablesVirtualmin集群ApplePostgreSQLIOSTcpdumpHAproxy监控NFSPHPWindowsDNSCurlsquidGolangJenkinsTensorFlowSwiftSSHFlutterSQLAlchemyPostfixWPSSecureCRTApacheMySQLCDNInnoDBSupervisor